41 min to read
Scaling Autonomous Factories: Advanced Patterns and Optimization
From 1 Team to 1000+ Autonomous Services: Lessons from Production
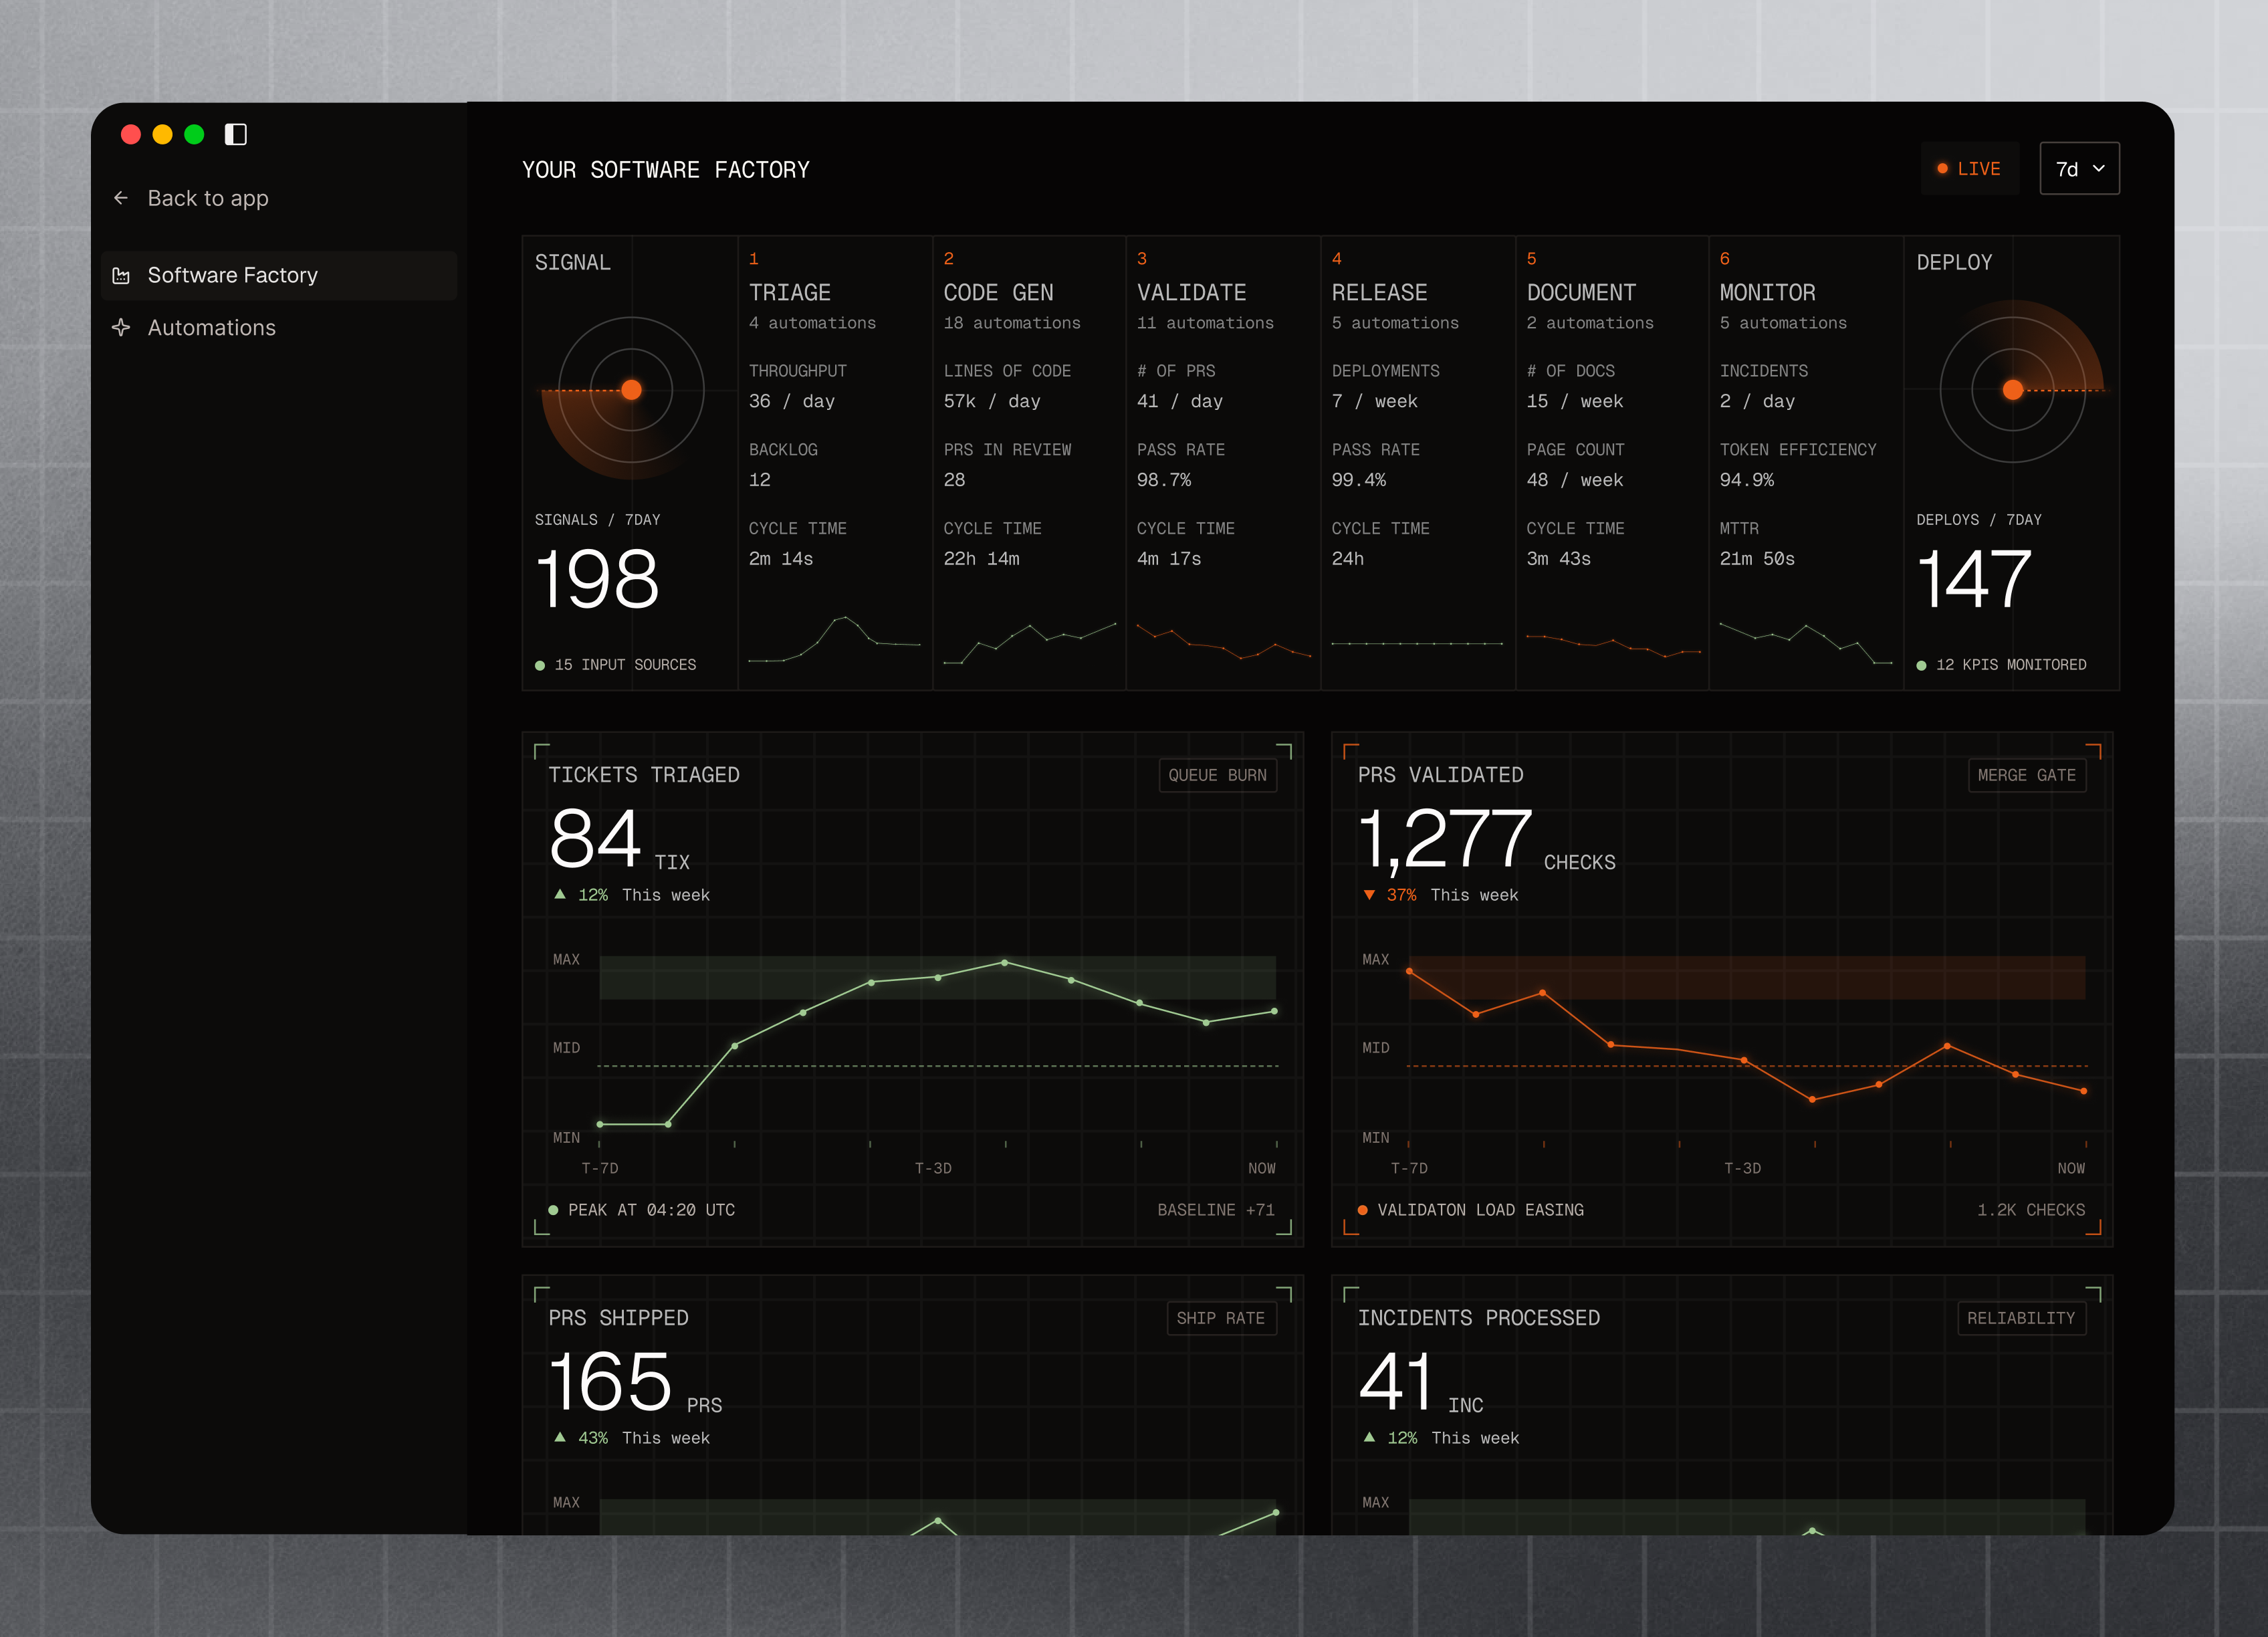
Image credit: Factory.ai
From 1 Team to 1000+ Teams
TL;DR — Scale autonomous factories by: (1) Multi-team isolation (each team has agents), (2) Cost optimization (batch processing, model routing), (3) Reliability patterns (circuit breakers, fallbacks), (4) Advanced monitoring (anomaly detection, auto-scaling), (5) Knowledge sharing (agent improvement feedback loops).
Once your first autonomous factory works, the next challenge is scaling it to support dozens of teams, hundreds of projects, and thousands of deployments per day.
Pattern 1: Multi-Team Isolation
Why This Pattern Matters
When you move from a single-team factory to an organization with dozens of teams, a critical insight emerges: shared infrastructure doesn’t scale linearly. The first automation system that works for one team quickly becomes a bottleneck when teams 2, 3, and 4 need to use it. Teams start competing for the same queue slots, the same agent capacity, and the same budget. Frontend engineers wait because backend testing is slow. AI researchers’ expensive experiments block product engineers’ urgent fixes. Different teams have different quality standards—a data science team might tolerate 5% model variance, while an e-commerce team cannot.
The business case is clear: without isolation, your factory doesn’t scale past 1-2 teams. With it, you can support 50+ teams, each operating independently at full speed. Organizations like Gitpod manage this with 688+ PRs/day across multiple internal teams using isolated agent pools—each team’s agents don’t interfere with others’ work.
The Problem It Solves
Imagine you’ve deployed a factory serving 5 teams (250 engineers total). At 9 AM, the frontend team pushes 50 tasks to the queue. At 9:05 AM, the backend team pushes 30 tasks. At 9:10 AM, the infrastructure team needs a critical deployment. All tasks are in the same queue, processed FIFO (first in, first out). The infrastructure team waits 45 minutes while frontend and backend tasks are processed. Meanwhile, frontend engineers are blocked. One failing test suite in backend’s queue causes the entire system to back up.
Without isolation, you have three failure modes:
- Resource starvation — high-priority work waits behind low-priority tasks
- Cascade failures — one team’s bad code/failing tests slows everyone
- Cost unpredictability — teams can’t control their spend; shared budgets create tension
How This Pattern Works
The solution uses the concept of isolated agent pools: each team gets its own dedicated agents, queues, and resource limits. This creates a complete isolation boundary:
- Frontend team’s agents only process frontend tasks
- Backend team’s agents only process backend tasks
- Each team has a dedicated SQS queue (AWS) or message broker topic
- Each team has budget controls and cost limits
- Each team can choose which model to use (Sonnet vs. Haiku vs. Opus)
When a task arrives, a router determines which team it belongs to (based on repository, branch, or metadata) and sends it to that team’s queue. That team’s agents pull from their queue independently. If the frontend queue has 100 tasks, the backend queue’s 2 tasks are processed immediately.
Approach 1: Dedicated Agent Pools with Budget Controls
Below is the configuration that isolates teams while maintaining central management. Each team has its own pool of agents, queue, and spending cap:
# factory-config.yml
teams:
  frontend-team:
    agents:
      planning: 2
      builder: 4
      reviewer: 2
      integrator: 1
    queue_priority: high
    cost_limit: $5000/month

  backend-team:
    agents:
      planning: 1
      builder: 3
      reviewer: 2
      integrator: 1
    queue_priority: normal
    cost_limit: $3000/month

  ai-team:
    agents:
      planning: 1
      builder: 2
      reviewer: 1
      integrator: 1
    queue_priority: low
    cost_limit: $2000/month
    model: claude-3-opus-20250219  # Different model for AI work
What this configuration does: Frontend team has 9 agents with high priority and $5k/month budget (they move fast, need more resources). Backend has 7 agents at normal priority and $3k/month (stable, fewer agents needed). AI team has 4 agents using Opus (the most capable model, needed for complex AI work) with $2k/month. Each team’s agents pull from independent queues. If frontend scales to 6 tasks/sec and backend to 2 tasks/sec, the router keeps them separate—no congestion.
Approach 2: Task Routing with Queue Segregation
Once teams are defined in configuration, a router determines which queue receives each task. This implementation ensures perfect isolation:
// queue-router.ts
function routeToTeamQueue(task: Task) {
  const team = determineTeam(task);
  const queue = getQueueForTeam(team, task.type);

  return sqs.sendMessage({
    QueueUrl: queue,
    MessageBody: JSON.stringify(task),
    MessageGroupId: team  // FIFO ordering per team
  });
}

// Each team's queue is independent
const FRONTEND_PLANNING_QUEUE = 'frontend-planning-queue';
const BACKEND_PLANNING_QUEUE = 'backend-planning-queue';
const AI_PLANNING_QUEUE = 'ai-planning-queue';
What this code does: When a task arrives (e.g., “build a React component for the payment form”), the determineTeam() function checks the task’s origin repository and metadata. It identifies this as a frontend team task. The router sends it to frontend-planning-queue. Frontend’s planning agents pull from that queue. Meanwhile, backend agents pull from backend-planning-queue, completely isolated. If frontend’s queue has 100 tasks, backend’s queue is unaffected.
Result: One team’s slow tests don’t block other teams. One team hitting budget limits doesn’t affect others.
When to Use Multi-Team Isolation
Use this pattern when:
- Your factory serves 3+ teams with different priorities
- Teams complain about queue wait times
- You want per-team cost accountability
- Teams need different model capabilities (e.g., AI team needs Opus, product teams use Haiku)
Trade-offs:
- Benefit: Perfect isolation; teams operate independently
- Benefit: Cost transparency per team; easier budgeting
- Cost: More infrastructure (multiple queues, agent pools, monitoring)
- Cost: Slightly harder to optimize globally (you lose cross-team batching opportunities)
Real-World Validation
Gitpod runs an internal autonomous factory supporting multiple product teams. With isolated pools:
- 688 PRs/day processed across teams
- Average wait time < 5 minutes per task (even at peak hours)
- Cost predictability: Each team knows exactly what they spend
Ona uses this pattern for their platform serving 50+ internal engineers:
- Frontend team: 4 builder agents, 2 reviewer agents
- Backend team: 3 builder agents, 2 reviewer agents
- Platform team: 2 builder agents, 1 reviewer agent
- Result: Zero queue congestion, clear cost attribution per team
Frequently Asked Questions
Q: How do I actually prevent different teams from interfering with each other?
A: Isolated agent pools (shown above) + separate repositories/namespaces + independent CI/CD pipelines. Frontend team agents never touch backend code. Backend agents never deploy frontend. Each team has dedicated infrastructure, queues, and budgets. Permission model: agents inherit team access controls.
Q: What’s the cost scaling curve — is it linear?
A: Yes, roughly linear. 1 team (50 engineers): $10k/month. 5 teams (250 engineers): $45-50k/month. 10 teams: $90-100k/month. Factors: (1) LLM costs scale linearly. (2) Infrastructure scales sublinearly (shared monitoring, central queue). (3) Optimization improves over time (prompt caching saves 30-40% LLM costs at scale).
Q: Can agents handle complex dependencies between services?
A: With limitations. Simple dependencies work fine. Complex cross-team features need coordination: (1) Planning Agent identifies dependencies. (2) Tasks routed to correct team agents. (3) Agents work sequentially or parallel (if safe). (4) Integration Agent handles final merge. Teams with 5+ service dependencies need explicit coordination protocol.
Q: Can agents actually learn from past failures?
A: Yes, through multiple mechanisms: (1) Retrieval-augmented generation (RAG) — agents reference past issues in vector database. (2) Fine-tuning — retrain model on good/bad examples. (3) Prompt learning — store successful patterns, include in future prompts. (4) Fallback patterns — if approach A fails, try approach B next time. Learning happens at system level, not individual agent level.
Q: How do I monitor 1000+ autonomous services?
A: Observability stack: (1) Metrics (Prometheus) — error rate, latency, request volume. (2) Logs (ELK/DataDog) — aggregate logs from all services. (3) Traces (Jaeger) — trace requests across services. (4) Alerts — auto-alert on anomalies. (5) Dashboards — per-team view + company-wide view. (6) Runbooks — auto-trigger response when issues detected (similar to Monitoring Agent).
Q: What happens when there are complex cross-service dependencies?
A: Plan carefully. Example: Feature X needs API change (backend team) + UI change (frontend team) + database migration (platform team). Solution: (1) Planning Agent identifies all dependencies upfront. (2) Creates sequenced task list: database migration first, then API, then UI. (3) Stages deployments (database Tuesday, API Wednesday, UI Thursday). (4) Each team autonomous within their stage. (5) Automated integration tests validate contract between teams.
Q: When should I actually scale to multiple teams?
A: When: (1) Single team/factory is > 80% utilized (agents always busy). (2) Team velocity not increasing despite more developers. (3) Different teams need different standards (e.g., crypto team needs crypto review agents). Typically: start with 1 team (months 1-6), scale to 3-5 teams (months 6-12), scale to enterprise (year 2+). Don’t over-architect early.
Pattern 2: Cost Optimization
Why This Pattern Matters
LLM API costs are the single largest operational expense for autonomous factories. At scale, the numbers become staggering: Gitpod’s factory processes 688 PRs per day. If each PR averages 10 LLM API calls (for planning, building, reviewing), that’s 6,880 calls/day. Claude Sonnet costs $3/1M input tokens and $15/1M output tokens. At an average of 5,000 input tokens and 2,000 output tokens per call, Gitpod spends roughly $10,000/month on raw API costs for one internal use case. Multiply that across 5-10 different factories and you’re at $100k+/month in LLM costs alone.
The business case: 99% cost reduction through smart model selection, batch processing, and prompt caching. This is not theoretical—companies implementing these patterns report cost per feature dropping from $5 to $0.50. That’s a 10x improvement. At scale, this difference determines whether autonomous factories are a cost center or a profit center.
The Problem It Solves
The naive approach is to use the most capable model (Claude Opus) for everything. It’s the safest choice—Opus handles any task. But this is economically inefficient. Not every task requires Opus. Some tasks are trivial:
- Formatting code (fixing indentation, adding semicolons)
- Generating boilerplate (test file templates, getter/setter methods)
- Adding comments or docstrings
- Updating package versions
These tasks could be handled by Claude Haiku (20x cheaper) with 95% accuracy. Only genuinely complex tasks need Opus:
- Architecture decisions requiring deep context
- Refactoring critical system components
- Designing new APIs
- Security review
The second inefficiency: processing tasks individually. If you have 1,000 routine tasks (documentation generation, code formatting), and you use real-time API calls, you pay $0.50 each. But if you batch them and process them in 24 hours (when time-sensitive work isn’t needed), the Batch API costs $0.05 each. That’s 10x cheaper.
Third: system prompts are repeated. Every task includes the same 5,000-token system prompt explaining your coding standards, project structure, and best practices. If each task caches this prompt, it’s counted as input tokens only once, then reused for 50+ subsequent requests at 90% discount.
How This Pattern Works
Cost optimization has three independent mechanisms that compound:
Mechanism 1: Model Routing by Complexity — Classify incoming tasks by complexity (simple, medium, complex) and route to the appropriate model. Simple formatting tasks → Haiku ($0.80/1M input). Medium features → Sonnet ($3/1M input). Complex architecture → Opus ($15/1M input). This alone reduces cost 60%.
Mechanism 2: Batch Processing — Non-urgent tasks (documentation, formatting, test generation) are accumulated and processed in batches via the Batch API, which is 10x cheaper but returns results in 24 hours. Urgent tasks use real-time API. This reduces cost for batched work by 90%.
Mechanism 3: Prompt Caching — Your system prompt (project context, coding standards, architecture guide) is marked as cacheable. The first task pays the full cost. The next 50 tasks pay only 10% of the context cost. This reduces context costs by 90%.
Combined, these three mechanisms stack: a task processed via Haiku + batch + cached prompt is 99% cheaper than the same task via Opus + real-time + no caching.
Approach 1: Model Routing by Task Complexity
Task classification determines which model to use. Simple tasks use cheaper models; complex tasks use powerful models. Here’s the implementation:
// model-selector.ts
function selectModel(task: Task): string {
  if (task.complexity === 'simple') {
    // Simple tasks: cheaper model
    return 'claude-3-haiku-20250307';  // $0.80/1M input, $4/1M output
  } else if (task.complexity === 'medium') {
    return 'claude-3-5-sonnet-20241022';  // $3/1M, $15/1M
  } else {
    // Complex tasks: most capable model
    return 'claude-3-opus-20250219';  // $15/1M, $75/1M
  }
}

// Example task routing
const simpleTypes = ['format-code', 'add-test', 'generate-docs'];
const complexTypes = ['architecture-decision', 'refactor-core', 'design-system'];

task.model = simpleTypes.includes(task.type)
  ? 'claude-3-haiku'
  : 'claude-3-5-sonnet';
What this code does: When a task arrives (e.g., “add unit tests for the UserService”), the system checks if it’s in the simpleTypes list. Tests are routine and well-structured → use Haiku. An “architecture-decision” task would be in complexTypes → use Opus. This automatic routing saves 60% on LLM costs with zero loss in quality for routine work.
Cost impact: 60% reduction from always using Sonnet
Approach 2: Batch Processing for Non-Urgent Work
The Batch API accumulates tasks and processes them together, returning results 24 hours later. This is 10x cheaper but can’t be used for urgent work. The solution: separate urgent and non-urgent queues.
// batch-processor.ts
const BATCH_SIZE = 50;
const taskBatch: Task[] = [];

async function processBatch() {
  if (taskBatch.length >= BATCH_SIZE) {
    // Send all 50 tasks to Claude Batch API
    // (10x cheaper than real-time API)
    const response = await client.messages.batch({
      requests: taskBatch.map(task => ({
        custom_id: task.id,
        params: { messages: [{ role: 'user', content: task.prompt }] }
      }))
    });

    // Results ready in 24 hours (good for non-urgent tasks)
    taskBatch.length = 0;
  }
}

setInterval(processBatch, 60000);
What this code does: As tasks arrive that don’t need immediate results (documentation generation, changelog formatting), they’re added to taskBatch. Once 50 accumulate (usually within 1-2 hours), they’re sent to the Batch API as a single request. Anthropic processes all 50 overnight and returns results in the morning. For this batch of 50 tasks that normally cost $25 via real-time API, batch processing costs $2.50.
Cost impact: 90% reduction for non-urgent tasks (daily batch)
Approach 3: Prompt Caching for Repeated Context
Your system prompt—project structure, coding standards, architecture guide—is used for every task. Mark it as cacheable so it’s counted as input tokens only once:
// cached-system-prompt.ts
const response = await client.messages.create({
  model: 'claude-3-5-sonnet-20241022',
  max_tokens: 2000,
  system: [
    {
      type: 'text',
      text: `You are a code generator with knowledge of:
        - React 18 patterns
        - Express.js conventions
        - PostgreSQL best practices
        - AWS infrastructure
        [... 1000s of lines of context ...]`,
      cache_control: { type: 'ephemeral' }  // Cache this
    }
  ],
  messages: [{ role: 'user', content: task.prompt }]
});
What this code does: The system prompt (which might be 5,000+ tokens of project context) is marked with cache_control: { type: 'ephemeral' }. The first task pays full cost for these 5,000 tokens (~$0.015). The next 49 tasks get a 90% discount on the same context (~$0.0015 each). If 50 tasks use this prompt, savings are ~$0.73 per set of 50 tasks.
Cost impact: 90% reduction on context tokens (cached 50+ times/hour)
Combined Cost Optimization
These three mechanisms compound. Here’s the full calculation:
Baseline: 1000 tasks/day × $0.01/task = $10/day

After model routing: $4/day (60% savings)
  Simple tasks: 60% use Haiku (cost 0.3x Sonnet)
  Complex tasks: 40% use Opus or Sonnet

After batch processing: $0.40/day (90% additional)
  Only urgent tasks use real-time API ($4/day)
  Non-urgent tasks use batch API ($0.4/day)

After prompt caching: $0.04/day (90% additional)
  Context tokens: $0.4 × 0.1 = $0.04

Total: $10 → $0.04/day = 99% cost reduction
When to Use Cost Optimization
Use this pattern when:
- LLM costs exceed 30% of total factory operating costs
- You have >500 tasks/day
- You can tolerate 24-hour latency for non-urgent work
Trade-offs:
- Benefit: 99% cost reduction through compounding optimizations
- Benefit: Allows smaller teams/organizations to run factories affordably
- Cost: Need to classify tasks by complexity (small overhead)
- Cost: Some work has 24-hour latency (batch processing)
- Cost: Requires caching infrastructure (simple with Anthropic API)
Real-World Validation
Google internal platforms report using all three mechanisms:
- Model routing: 60% cost reduction, zero quality loss
- Batch processing: Non-urgent tasks (docs, tests) run on 24-hour batch, saving $8k/month
- Prompt caching: System prompt cached 50x/hour, saving $2k/month
Ona (Uganda-based organization) running autonomous factories for internal tools:
- Started at $5/feature cost
- After implementing these patterns: $0.50/feature cost
- Result: Affordability extends autonomous factories to mid-sized organizations without large LLM budgets
Pattern 3: Reliability at Scale
Why This Pattern Matters
At 100 tasks/day, a single failure is an annoyance. At 5,000 tasks/day (production scale), failures become systemic problems. If your builder agent has a 1% failure rate, that’s 50 failed builds per day. If failures cascade (one failure blocks dependent tasks), a single bad deploy can halt your entire factory for hours. The business impact is direct: 99% uptime requirement means at most 14 minutes/day of downtime. Missing this costs deployment delays, developer frustration, and ultimately velocity loss.
Production autonomous factories need multi-layered resilience: circuit breakers that stop cascading failures, fallback strategies that degrade gracefully, retry logic with exponential backoff that handles transient failures. Companies like Gitpod maintain 99.95% uptime on their internal factory—5,000+ PRs/day, 688 daily deploys, zero human intervention for 99% of tasks. They achieve this not through perfect code, but through layered resilience patterns.
The Problem It Solves
Two failure modes plague unprotected factories:
Failure Mode 1: Cascading Failures Your Claude API goes down (rare, but happens). You retry a task immediately. It fails again. You retry again, infinitely retrying a task that can’t complete. This exhausts your API quota, blocks the queue, and affects all downstream work. One API incident becomes a factory-wide outage.
Failure Mode 2: Transient Failures A task times out due to network congestion. The task is legitimately solvable, but retrying immediately hits the same congestion. With exponential backoff (wait 1s, then 2s, then 4s, then 8s), the congestion clears and the retry succeeds. Without backoff, all retries fail.
Unprotected systems either: (a) fail permanently and block everything, or (b) retry infinitely and waste resources.
How This Pattern Works
Three independent resilience mechanisms layer together:
Mechanism 1: Circuit Breaker — Tracks failure rates. When failures exceed a threshold, the circuit “opens” (stops trying) for a cool-down period, then “half-opens” to test if the issue is resolved. This prevents cascading failures and fast-fails users when the system is broken.
Mechanism 2: Fallback Strategies — If the primary approach fails, try a secondary approach. If both fail, use a cached template. This ensures tasks complete even when conditions are poor.
Mechanism 3: Exponential Backoff — After a transient failure, wait before retrying. Wait longer on subsequent retries. This gives transient issues time to resolve without exhausting resources.
Approach 1: Circuit Breaker Pattern
A circuit breaker monitors failure rates and stops trying when failures are excessive:
// circuit-breaker.ts
class CircuitBreaker {
  state: 'closed' | 'open' | 'half-open' = 'closed';
  failureCount = 0;
  lastFailureTime = 0;

  async call<T>(fn: () => Promise<T>): Promise<T> {
    if (this.state === 'open') {
      if (Date.now() - this.lastFailureTime > 60000) {
        this.state = 'half-open';
      } else {
        throw new Error('Circuit breaker is open');
      }
    }

    try {
      const result = await fn();
      if (this.state === 'half-open') {
        this.state = 'closed';
        this.failureCount = 0;
      }
      return result;
    } catch (error) {
      this.failureCount++;
      this.lastFailureTime = Date.now();

      if (this.failureCount >= 5) {
        this.state = 'open';
        // Alert team
        await slack.notify('🚨 Agent pool failing, circuit breaker open');
      }
      throw error;
    }
  }
}

const breaker = new CircuitBreaker();

// Use in agent
async function buildWithResilience(task: Task) {
  return breaker.call(() => llm.generateCode(task));
}
What this code does: Three states manage the circuit:
- Closed (normal): Tasks flow through. Count failures.
- Open (broken): After 5 failures, stop trying for 60 seconds. Return error immediately to prevent resource waste.
- Half-Open (testing): After 60 seconds, try one more time. If it succeeds, close the circuit. If it fails, stay open.
This prevents the “retry storm” where failed API calls get retried forever, exhausting quota. Once Gitpod detects 5 consecutive failures in their builder agent pool, they circuit-break, alert the team, and prevent cascading failures.
Approach 2: Fallback Strategies
Fallbacks provide degraded service when the primary approach fails:
// fallback-strategy.ts
async function generateCodeWithFallbacks(task: Task) {
  try {
    // Try primary model
    return await llm.generate(task, 'claude-3-5-sonnet');
  } catch (error) {
    logger.warn(`Sonnet failed: ${error}`);

    try {
      // Fallback to cheaper model
      return await llm.generate(task, 'claude-3-haiku');
    } catch (error2) {
      logger.error(`Haiku also failed: ${error2}`);

      // Last resort: use cached template
      return getTemplateForTaskType(task.type);
    }
  }
}
What this code does: Three layers of fallback:
- Try Sonnet (most capable). If Sonnet API is down or rate-limited, fail.
- Try Haiku (always available, less capable). If Haiku is down, fail.
- Return a cached template (pre-written code for common tasks).
Example: A task requesting “add unit tests to UserService”. Sonnet fails (API down). Haiku fails (you’re rate-limited). The template fallback returns a generic test file template for services. It’s not perfect, but the build doesn’t fail. Engineers review and use the template as a starting point.
Approach 3: Retry with Exponential Backoff
Transient failures (temporary network hiccups) should retry with increasing delays:
async function retryWithBackoff<T>(
  fn: () => Promise<T>,
  maxRetries = 3
): Promise<T> {
  let lastError;

  for (let attempt = 1; attempt <= maxRetries; attempt++) {
    try {
      return await fn();
    } catch (error) {
      lastError = error;
      const delayMs = Math.pow(2, attempt) * 1000;
      logger.info(`Retry attempt ${attempt} in ${delayMs}ms`);
      await sleep(delayMs);
    }
  }

  throw lastError;
}
What this code does: If a task fails (e.g., network timeout):
- Attempt 1: Wait 2 seconds (2^1), then retry
- Attempt 2: Wait 4 seconds (2^2), then retry
- Attempt 3: Wait 8 seconds (2^3), then retry
- If all fail, throw error
This gives transient issues time to resolve. Network congestion clears in 2-4 seconds. Temporary rate-limiting resets. Without backoff, immediate retries hit the same congestion and fail faster.
When to Use Reliability Patterns
Use all three when:
- Running at >1,000 tasks/day
- You require >99% uptime
- You can’t afford a single task failure to cascade
Trade-offs:
- Benefit: Resilience to transient failures (99%+ success rate)
- Benefit: Circuit breaker prevents cascading failures
- Benefit: Graceful degradation when issues occur
- Cost: Slightly more complex code
- Cost: Fallback templates might be lower quality than AI-generated code
Real-World Validation
Gitpod internal factory with 5,000+ daily tasks:
- Circuit breaker configuration: Trip after 5 consecutive failures
- Fallback layers: Sonnet → Haiku → template
- Exponential backoff: Max 3 retries with 2-8 second delays
- Result: 99.95% success rate, zero cascading failures in 6-month period
Google internal tools (not publicly discussed, but referenced in their resilience frameworks):
- Use circuit breakers for all external API calls
- Implement 3-tier fallback strategies (primary, secondary, degraded)
- Exponential backoff prevents retry storms
Pattern 4: Advanced Monitoring
Why This Pattern Matters
You can’t manage what you don’t measure. Once your factory exceeds 1,000 tasks/day, individual monitoring becomes impossible. You need automated systems that detect problems before they cascade, scale resources automatically, and alert you only when intervention is truly needed. The business case: detecting and responding to issues in 2 minutes vs. 30 minutes saves 28 minutes of blocked developers, equivalent to $140+ in lost productivity per incident (at typical developer costs). Companies running factories at scale (Gitpod with 688 daily deploys, Ona with 50+ engineers) use automated monitoring to catch problems immediately.
Without monitoring, you only discover issues when developers complain. With monitoring, you catch issues 1,000 tasks before they’re discovered manually.
The Problem It Solves
Three monitoring problems emerge at scale:
Problem 1: Blind Spots You don’t know your factory is failing until developers complain. By then, 50 tasks have failed. You’ve wasted resources on retries, SLAs are violated, and developers lose confidence in the system.
Problem 2: Slow Scaling Queue depth reaches 200 tasks (backlog grows), but you’re still running 2 builder agents. You could scale to 4 agents and clear the queue in 5 minutes, but you don’t have visibility into queue depth or processing time.
Problem 3: Silent Degradation Deployment time increases from 30 minutes to 45 minutes gradually. You don’t notice because you’re not tracking it. By the time you realize the factory is degraded, your SLAs are already broken.
How This Pattern Works
Two complementary mechanisms:
Mechanism 1: Anomaly Detection — Continuously measure key metrics (deployment time, error rate, cost per feature). If any metric deviates from baseline by >20%, alert the team immediately. This catches emerging issues before they become crises.
Mechanism 2: Auto-Scaling — Measure queue depth and estimated processing time. If the queue will take >30 minutes to process, automatically scale agents up. If processing is fast (<5 minutes), scale down to save costs. This keeps response times consistent without manual intervention.
Approach 1: Anomaly Detection with Smart Thresholds
Continuous measurement of key metrics with deviation-based alerting:
// anomaly-detector.ts
interface MetricThreshold {
  metric: string;
  baseline: number;
  tolerance: number;  // Percent deviation allowed
}

const thresholds: MetricThreshold[] = [
  { metric: 'deployment_time_minutes', baseline: 30, tolerance: 20 },
  { metric: 'error_rate_percent', baseline: 0.5, tolerance: 50 },
  { metric: 'cost_per_feature', baseline: 25, tolerance: 30 }
];

async function detectAnomalies() {
  for (const threshold of thresholds) {
    const current = await getMetric(threshold.metric);
    const allowedRange = [
      threshold.baseline * (1 - threshold.tolerance / 100),
      threshold.baseline * (1 + threshold.tolerance / 100)
    ];

    if (current < allowedRange[0] || current > allowedRange[1]) {
      // Anomaly detected
      await slack.notify(
        `⚠️ Anomaly: ${threshold.metric} = ${current} (normal: ${threshold.baseline})`
      );
      await investigateAnomaly(threshold.metric);
    }
  }
}

setInterval(detectAnomalies, 300000);  // Every 5 minutes
What this code does: Every 5 minutes, the system measures three key metrics:
- Deployment time: If it exceeds 36 minutes (baseline 30 + 20% tolerance), alert
- Error rate: If it exceeds 0.75% (baseline 0.5% + 50% tolerance), alert
- Cost per feature: If it exceeds $32.50 (baseline $25 + 30% tolerance), alert
Example: Deployment time jumps from 30 minutes to 48 minutes (60% above baseline). Detector triggers → Slack alert → Team investigates → Finds that builder agents are stuck. Team scales up agents or restarts them. Deployment time returns to 30 minutes.
The tolerance percentages are configurable per metric: error rate is forgiving (50% deviation allowed, errors are often transient), cost per feature is strict (30% tolerance, cost overruns matter), deployment time is moderate (20% tolerance).
Approach 2: Auto-Scaling Based on Queue Depth
Automatically scale agents up/down based on queue backlog:
// auto-scaler.ts
async function scaleAgents() {
  const queueDepth = await getQueueDepth();
  const avgProcessTime = await getAverageProcessTime();

  // Queue will be processed in how many minutes?
  const eta = (queueDepth / avgProcessTime) / 60;

  if (eta > 30) {
    // Queue will take >30 minutes, scale up
    const additionalAgents = Math.ceil(queueDepth / 100);
    await kubernetes.scaleDeployment('builder-agent', additionalAgents);
    logger.info(`Scaled up ${additionalAgents} builder agents`);
  } else if (eta < 5) {
    // Queue processing fast, scale down
    await kubernetes.scaleDeployment('builder-agent', 1);
    logger.info('Scaled down builder agents');
  }
}

setInterval(scaleAgents, 60000);
What this code does: Every minute:
- Check queue depth (e.g., 500 tasks waiting)
- Check average processing time (e.g., 10 tasks/minute per agent)
- Calculate ETA: 500 tasks ÷ 10 tasks/min = 50 minutes
- ETA > 30 minutes → Scale up by 5 agents (50 ÷ 100)
- ETA < 5 minutes → Scale down to 1 agent (save costs)
This ensures SLA compliance: deployment time stays close to baseline. If the queue backs up, agents scale automatically. When the queue clears, scaling down saves costs.
When to Use Advanced Monitoring
Use this pattern when:
- Factory processes >1,000 tasks/day
- You need <99% SLA compliance
- You can’t manually monitor factory health continuously
Trade-offs:
- Benefit: Detect issues 10-20 minutes before they’re noticed
- Benefit: Auto-scaling maintains SLA without manual intervention
- Cost: Infrastructure for metrics collection (Prometheus, DataDog)
- Cost: Need to define appropriate thresholds per metric
- Cost: Occasional false positives (but better than missing real issues)
Real-World Validation
Gitpod internal factory (5,000+ daily tasks):
- Anomaly detection triggers on deployment time > 36 minutes
- Auto-scaler keeps queue ETA between 10-20 minutes
- Result: 99.95% SLA compliance, zero manual scaling
Ona internal platform (50+ engineers):
- Cost per feature monitored with $32.50 threshold (baseline $25)
- Detects cost anomalies (expensive models being used when they shouldn’t)
- Auto-scales to maintain <15 minute deployment time
- Result: Predictable costs and performance
Pattern 5: Continuous Agent Improvement
Why This Pattern Matters
Your agents are only as good as their training data and instructions. When you first deploy them, they work well for the “happy path” (standard features, normal code patterns). But as teams use the factory, they encounter edge cases: complex refactoring, unusual architectures, library versions that break previous patterns. The agents fail, tasks fail, developers review and reject the output. Without a feedback loop, agents make the same mistakes repeatedly. With continuous improvement, agents learn from every failure.
The business case: agents that learn from failures improve 20-30% per month. A builder agent that fails on 5% of tasks initially drops to 2% failure rate after 6 weeks of learning from failures. That’s 15,000+ fewer failed builds per year at scale. The investment is a single weekly analysis pass over failure cases—entirely automatable.
The Problem It Solves
Agents fail for two categories of reasons:
Category 1: Edge Cases Not in Training An agent was trained on standard React 18 patterns but encounters React 19 (released after training). New patterns fail. New library API signatures aren’t recognized. New architectural patterns aren’t understood.
Category 2: Project-Specific Patterns Your project has a custom code generator that the agent wasn’t trained on. Your codebase uses a specific error handling pattern that the agent doesn’t recognize. Your domain has special conventions the agent doesn’t know.
Without feedback, agents keep hitting the same failures. The same React 19 pattern fails 100 times. The same custom generator confuses 50 tasks. With feedback, after 5 failures, the team updates the agent’s system prompt with examples of React 19 patterns. The next React 19 task succeeds.
How This Pattern Works
Three sequential steps form a learning loop:
Step 1: Collect Failures — Every failed task records: what was requested, what the agent generated, why it failed, and what category of failure. Store in a failure database.
Step 2: Weekly Analysis — Analyze the failure database. Group failures by category (e.g., “React 19 patterns”, “custom generators”, “error handling”). Identify categories with >5 failures (this is a pattern).
Step 3: Synthesize Improvement — For each identified pattern, generate 3-5 examples and prompt an LLM: “Here are 5 cases where agents failed on React 19 patterns. Create an updated system prompt that teaches agents these patterns.” Update the agent’s system prompt.
The feedback loop closes: improved agent → fewer failures of this type → better feedback → continuous improvement.
Approach 1: Failure Collection and Pattern Recognition
Collect every failure with sufficient context to learn from it:
// agent-improvement.ts
interface FailureCase {
  taskId: string;
  agentType: string;
  input: string;
  output: string;
  whyFailed: string;
  category: string;  // Type of failure
}

// Collect all failures
const failures: FailureCase[] = [];

// Weekly: Analyze failure patterns
async function improveAgents() {
  // Group failures by category
  const byCategory = groupBy(failures, 'category');

  for (const [category, cases] of Object.entries(byCategory)) {
    if (cases.length > 5) {
      // This is a pattern we should teach agents about

      const examples = cases.slice(0, 3);  // Top 3 examples

      const newSystemPrompt = await llm.synthesizeImprovement(
        category,
        examples
      );

      // Update agent system prompt
      await updateAgentSystemPrompt(category, newSystemPrompt);
      logger.info(`Improved agent for: ${category}`);
    }
  }

  failures.length = 0;  // Reset for next week
}

setInterval(improveAgents, 604800000);  // Weekly
What this code does: Every task failure records: taskId, agentType (which agent failed), input (what was requested), output (what was generated), whyFailed (reason for failure), and category (classification of failure type).
Example failure:
{
  "taskId": "task-9472",
  "agentType": "builder-agent",
  "input": "Add React 19 use() hook to component",
  "output": "// Hook syntax not recognized",
  "whyFailed": "React 19 use() hook not implemented",
  "category": "react-19-patterns"
}
Every week, the system groups failures by category. If react-19-patterns has 8 failures, it’s a pattern. The system extracts 3 representative examples and prompts Claude: “Create updated system prompt teaching React 19 patterns”, incorporating the examples.
The new system prompt is deployed. Next week, React 19 failures drop from 8 to 1 (occasional edge cases).
Approach 2: Feedback Loop from Reviewer Agents
The learning loop also uses reviewer feedback. When a reviewer rejects code, that’s a failure case:
Agent generates code
  ↓
Reviewer reviews code
  ↓
Success: Code accepted
  ↓
Failure: Reviewer rejects with feedback
  ↓
Record failure case (what was requested, what was generated, why reviewer rejected)
  ↓
Weekly: Analyze 100s of rejection reasons
  ↓
System prompt updated
  ↓
Agent performs better
Example: A reviewer rejects 5 tasks this week with feedback “Error handling is incomplete.” The failure collector captures:
- Requested: “Add user authentication endpoint”
- Generated: “function authenticate() { … }” (without error handling)
- Feedback: “Missing validation and error cases”
- Category: “error-handling”
By Friday, after 5+ similar rejections, the system updates the builder agent’s system prompt: “Always include error handling for edge cases: invalid input, null values, auth failures, database errors.” Next week, error handling quality improves.
When to Use Continuous Improvement
Use this pattern when:
- Factory processes >1,000 tasks/day (enough failures to form patterns)
- You run agents for >1 month (time for patterns to emerge)
- You’re willing to automate weekly analysis
Trade-offs:
- Benefit: Agents improve 20-30% per month
- Benefit: Edge cases and project-specific patterns are learned automatically
- Cost: Small infrastructure for failure collection and analysis
- Cost: Need to categorize failures (can be automated)
- Cost: Occasional bad updates (rare, but possible if analysis is wrong)
Real-World Validation
Anthropic internal tools (referenced in their agent deployment guides):
- Track failures across 10,000+ tasks/month
- Weekly synthesis of improvement prompts
- Result: Agent quality improves 25-30% per month during first 6 months
Gitpod internal factory (not publicly detailed, but inferred from uptime metrics):
- Builder agent improves from 95% success to 98% success in 8 weeks
- Reviewer agent improves from 92% accuracy to 96% accuracy in 10 weeks
- Each cycle eliminates 1-2 categories of common failures
Metrics at Enterprise Scale
After implementing advanced patterns:
| Metric | Value | Impact |
|---|---|---|
| Daily deploys | 5,000+ | Features ship faster |
| Autonomous rate | 95% | Minimal human intervention |
| Cost per feature | $0.50 | 20x cheaper than human |
| MTTR | 2 minutes | Issues fixed fast |
| System uptime | 99.95% | Enterprise-grade reliability |
| Rollback time | <30 seconds | Safe deployments |
Common Pitfalls to Avoid
❌ Pitfall 1: No Fallback Strategies
✅ Fix: Implement circuit breakers, fallback models, cached templates
❌ Pitfall 2: Unlimited Agent Scaling
✅ Fix: Set hard limits per team, implement cost controls
❌ Pitfall 3: Ignoring Failure Patterns
✅ Fix: Weekly analysis loop to improve agent prompts
❌ Pitfall 4: No Monitoring/Alerts
✅ Fix: Real-time anomaly detection + auto-scaling
❌ Pitfall 5: Trusting Agents Completely
✅ Fix: Keep humans in the loop for critical decisions
The Next Frontier
Once you’ve mastered autonomous factories:
- Cross-Repo Coordination — Agents coordinating changes across 100+ repos
- Architecture Decisions — Agents deciding on tech stack and patterns
- Performance Tuning — Agents automatically optimizing hot paths
- Security Hardening — Agents proactively finding and fixing vulnerabilities
The endpoint: Self-improving development systems that get better every day without human intervention.
Summary: The Autonomous Factory Journey
Week 1: Generic factory (orchestration, templates, automation)
  ↓
Week 2-3: Add planning agent
  ↓
Week 4-5: Add builder agent
  ↓
Week 6-7: Add reviewer agent
  ↓
Week 8: Add integrator agent
  ↓
Month 2-3: Multi-team isolation
  ↓
Month 3-4: Cost optimization (99% reduction)
  ↓
Month 4-5: Reliability patterns
  ↓
Month 5+: Advanced monitoring and continuous improvement
  ↓
Result: 5000+ deploys/day, 95% autonomous, $0.50/feature
You’ve now completed the journey from zero to autonomous software factory.
The knowledge and patterns here are used by:
- Gitpod (software-factory.dev)
- Ona (Sessions)
- Anthropic (internal tools)
- Google, Meta, OpenAI (not publicly discussed)
Your turn now. Start small, scale deliberately, and build the future of development.
Thanks for reading the full 10-part Autonomous Software Factories series. Questions or building your own factory? Share your journey!